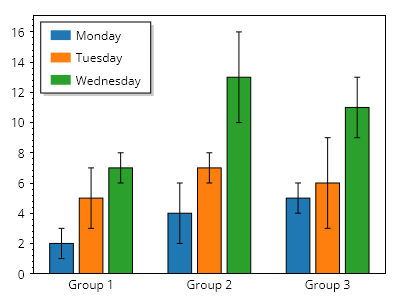
グループ化棒グラフ
棒は位置と色でグループ化できます。
ScottPlot.Plot myPlot = new();

ScottPlot.Palettes.Category10 palette = new();

ScottPlot.Bar[] bars =
{
    // 1つ目のグループ
    new() { Position = 1, Value = 2, FillColor = palette.GetColor(0), Error = 1 },
    new() { Position = 2, Value = 5, FillColor = palette.GetColor(1), Error = 2 },
    new() { Position = 3, Value = 7, FillColor = palette.GetColor(2), Error = 1 },

    // 2つ目のグループ
    new() { Position = 5, Value = 4, FillColor = palette.GetColor(0), Error = 2 },
    new() { Position = 6, Value = 7, FillColor = palette.GetColor(1), Error = 1 },
    new() { Position = 7, Value = 13, FillColor = palette.GetColor(2), Error = 3 },

    // 3つ目のグループ
    new() { Position = 9, Value = 5, FillColor = palette.GetColor(0), Error = 1 },
    new() { Position = 10, Value = 6, FillColor = palette.GetColor(1), Error = 3 },
    new() { Position = 11, Value = 11, FillColor = palette.GetColor(2), Error = 2 },
};

myPlot.Add.Bars(bars);

// 凡例を手動で構築する
myPlot.Legend.IsVisible = true;
myPlot.Legend.Alignment = Alignment.UpperLeft;
myPlot.Legend.ManualItems.Add(new() { LabelText = "月曜日", FillColor = palette.GetColor(0) });
myPlot.Legend.ManualItems.Add(new() { LabelText = "火曜日", FillColor = palette.GetColor(1) });
myPlot.Legend.ManualItems.Add(new() { LabelText = "水曜日", FillColor = palette.GetColor(2) });

// 下軸にグループラベルを表示する
Tick[] ticks =
{
    new(2, "グループ 1"),
    new(6, "グループ 2"),
    new(10, "グループ 3"),
};
myPlot.Axes.Bottom.TickGenerator = new ScottPlot.TickGenerators.NumericManual(ticks);
myPlot.Axes.Bottom.MajorTickStyle.Length = 0;
myPlot.HideGrid();

// 棒の下に余白を入れずに自動スケールするようプロットに指示する
myPlot.Axes.Margins(bottom: 0);

myPlot.SavePng("demo.png", 400, 300);
このレシピは、棒グラフカテゴリにある多数のレシピの1つです