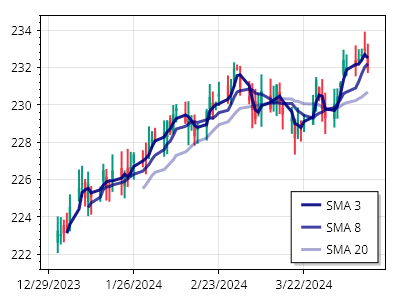
単純移動平均
単純移動平均(SMA)曲線を作成し、それを金融データの横に表示するためのツールがあります。
ScottPlot.Plot myPlot = new();

// 時系列の価格データを生成してプロットする
var prices = Generate.RandomOHLCs(75);
myPlot.Add.Candlestick(prices);
myPlot.Axes.DateTimeTicksBottom();

// SMAを計算し、散布図として表示する
int[] windowSizes = { 3, 8, 20 };
foreach (int windowSize in windowSizes)
{
    ScottPlot.Finance.SimpleMovingAverage sma = new(prices, windowSize);
    var sp = myPlot.Add.Scatter(sma.Dates, sma.Means);
    sp.LegendText = $"SMA {windowSize}";
    sp.MarkerSize = 0;
    sp.LineWidth = 3;
    sp.Color = Colors.Navy.WithAlpha(1 - windowSize / 30.0);
}

myPlot.ShowLegend();

myPlot.SavePng("demo.png", 400, 300);
このレシピは、金融プロットカテゴリに含まれる多数のレシピの1つです