DateTime 軸を使用したヒートマップ
ヒートマップは、水平軸に数値ではなく日付を使用するプロットに表示できます。
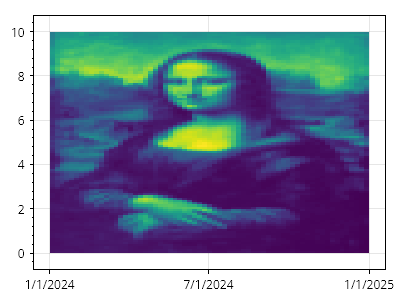
ScottPlot.Plot myPlot = new();

// プロットにヒートマップを追加する
double[,] data = SampleData.MonaLisa();
var hm = myPlot.Add.Heatmap(data);

// 数値単位を使用してその高さを定義する
CoordinateRange yRange = new(0, 10);

// 日付単位を使用してその幅を定義する
DateTime start = new(2024, 01, 01);
DateTime end = new(2025, 01, 01);
CoordinateRange xRange = new(start.ToOADate(), end.ToOADate());

// ヒートマップに幅と高さを適用する
hm.Rectangle = new(xRange, yRange);

// X 軸の目盛りラベルに日付形式を使用するようプロットに指示する
myPlot.Axes.DateTimeTicksBottom();

myPlot.SavePng("demo.png", 400, 300);
このレシピは、ヒートマップカテゴリに含まれる多数のレシピの 1 つです