ヒストグラムのクイックスタート
ヒストグラムは値のコレクションから作成できます。
ScottPlot.Plot myPlot = new();
// 値のコレクションからヒストグラムを作成する
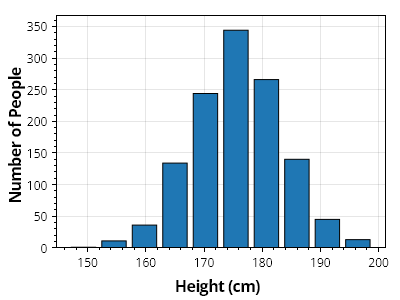
double[] heights = SampleData.MaleHeights();
var hist = ScottPlot.Statistics.Histogram.WithBinCount(10, heights);
// ヒストグラムを棒グラフとして表示する
var barPlot = myPlot.Add.Bars(hist.Bins, hist.Counts);
// 各棒のサイズをビンの幅よりわずかに小さくする
foreach (var bar in barPlot.Bars)
{
bar.Size = hist.FirstBinSize * .8;
}
// プロットのスタイルをカスタマイズする
myPlot.Axes.Margins(bottom: 0);
myPlot.YLabel("人数");
myPlot.XLabel("身長 (cm)");
myPlot.SavePng("demo.png", 400, 300);
このレシピは、ヒストグラムカテゴリーに含まれる多数のレシピの1つです