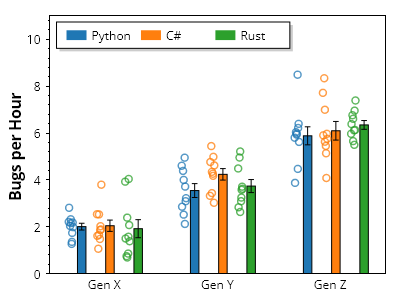
母集団グループ
母集団のグループは、位置、色、軸ラベル、凡例項目をカスタマイズすることで実現できます。
ScottPlot.Plot myPlot = new();

// グループを定義する
string[] groupNames = { "Gen X", "Gen Y", "Gen Z" };
string[] categoryNames = { "Python", "C#", "Rust" };
Color[] categoryColors = { Colors.C0, Colors.C1, Colors.C2 };

// ランダムデータをプロットに追加する
for (int groupIndex = 0; groupIndex < groupNames.Length; groupIndex++)
{
    for (int categoryIndex = 0; categoryIndex < categoryNames.Length; categoryIndex++)
    {
        double[] values = Generate.RandomNormal(10, mean: 2 + groupIndex *2);
        double x = groupIndex* (categoryNames.Length + 1) + categoryIndex;
        var pop = myPlot.Add.Population(values, x);
        pop.Marker.MarkerLineColor = categoryColors[categoryIndex].WithAlpha(.75);
        pop.Marker.Size = 7;
        pop.Marker.LineWidth = 1.5f;
        pop.Bar.FillColor = categoryColors[categoryIndex];
    }
}

// グループ名を水平方向の目盛ラベルに適用する
double tickDelta = categoryNames.Length + 1;
double[] tickPositions = Enumerable.Range(0, groupNames.Length)
    .Select(x => x * tickDelta + tickDelta / 2 - 1)
    .ToArray();
myPlot.Axes.Bottom.SetTicks(tickPositions, groupNames);
myPlot.Axes.Bottom.MajorTickStyle.Length = 0;

// 凡例にカテゴリの色を表示する
for (int i = 0; i < categoryNames.Length; i++)
{
    LegendItem item = new()
    {
        FillColor = categoryColors[i],
        LabelText = categoryNames[i]
    };
    myPlot.Legend.ManualItems.Add(item);
}
myPlot.Legend.Orientation = Orientation.Horizontal;
myPlot.Legend.Alignment = Alignment.UpperLeft;

// プロットの外観を調整する
myPlot.Axes.Margins(bottom: 0, top: 0.3);
myPlot.YLabel("1時間あたりのバグ数");
myPlot.HideGrid();

myPlot.SavePng("demo.png", 400, 300);
このレシピは、母集団プロットカテゴリに含まれる多数のレシピの1つです