散布図クイックスタート
散布図は、X 値と Y 値を含む 2 つの配列から作成できます。
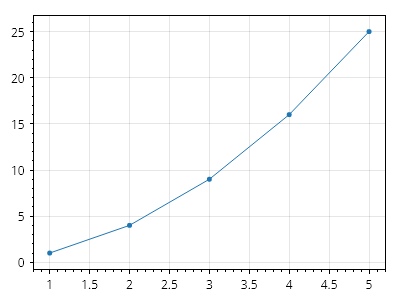
ScottPlot.Plot myPlot = new();

double[] xs = { 1, 2, 3, 4, 5 };
double[] ys = { 1, 4, 9, 16, 25 };

myPlot.Add.Scatter(xs, ys);

myPlot.SavePng("demo.png", 400, 300);
このレシピは、散布図カテゴリーに含まれる多くのレシピの 1 つです