散布図
散布図は、X/Y データポイントを表示するために使用できます。
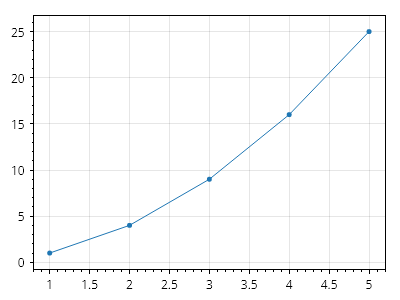
ScottPlot.Plot myPlot = new();

// サンプルデータを作成する
double[] dataX = { 1, 2, 3, 4, 5 };
double[] dataY = { 1, 4, 9, 16, 25 };

// プロットに散布図を追加する
myPlot.Add.Scatter(dataX, dataY);

myPlot.SavePng("demo.png", 400, 300);
このレシピは、クイックスタートカテゴリに含まれる多数のレシピの 1 つです