積み上げ棒グラフ
棒は、データをグループ単位で表すために積み上げることができます。
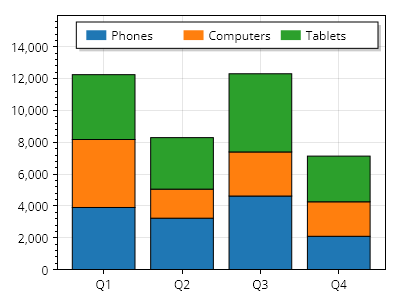
ScottPlot.Plot myPlot = new();

string[] categoryNames = { "電話", "コンピューター", "タブレット" };
Color[] categoryColors = { Colors.C0, Colors.C1, Colors.C2 };

for (int x = 0; x < 4; x++)
{
    double[] values = Generate.RandomSample(categoryNames.Length, 1000, 5000);

    double nextBarBase = 0;

    for (int i = 0; i < values.Length; i++)
    {
        ScottPlot.Bar bar = new()
        {
            Value = nextBarBase + values[i],
            FillColor = categoryColors[i],
            ValueBase = nextBarBase,
            Position = x,
        };

        myPlot.Add.Bar(bar);

        nextBarBase += values[i];
    }
}

// 下部にカスタム目盛りラベルを使用する
ScottPlot.TickGenerators.NumericManual tickGen = new();
for (int x = 0; x < 4; x++)
{
    tickGen.AddMajor(x, $"Q{x + 1}");
}
myPlot.Axes.Bottom.TickGenerator = tickGen;

// 凡例にグループを表示する
for (int i = 0; i < 3; i++)
{
    LegendItem item = new()
    {
        LabelText = categoryNames[i],
        FillColor = categoryColors[i]
    };
    myPlot.Legend.ManualItems.Add(item);
}
myPlot.Legend.Orientation = Orientation.Horizontal;
myPlot.ShowLegend(Alignment.UpperRight);

// 棒の下に余白を入れずに自動スケールするようプロットに指示する
myPlot.Axes.Margins(bottom: 0, top: .3);

myPlot.SavePng("demo.png", 400, 300);
このレシピは、棒プロットカテゴリに含まれる多数のレシピの 1 つです