ヒストグラムバー
ヒストグラムの度数を表示する棒グラフを簡単に作成できるように、ヘルパーメソッドとプロット型が作成されています。ヒストグラムの更新はリアルタイムに表示され、プロットは最新のデータを表示するように自動的に更新されることに注意してください。
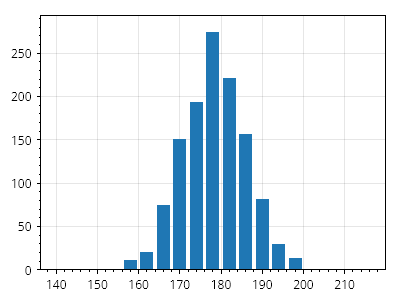
ScottPlot.Plot myPlot = new();

// 空のヒストグラムを作成し、棒グラフとして表示する
var hist = ScottPlot.Statistics.Histogram.WithBinCount(count: 20, minValue: 140, maxValue: 220);
var histPlot = myPlot.Add.Histogram(hist);
histPlot.BarWidthFraction = 0.8;

// 新しいデータが追加されると、ヒストグラムの度数は自動的に更新される
double[] newData = SampleData.MaleHeights();
hist.AddRange(newData);

myPlot.SavePng("demo.png", 400, 300);
このレシピは、ヒストグラムカテゴリにある多数のレシピのうちの1つです