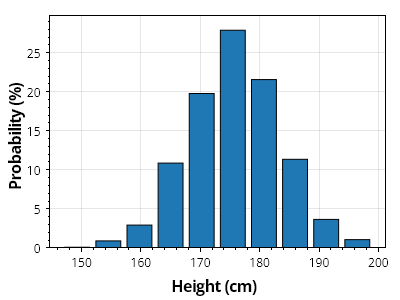
確率のヒストグラム
ヒストグラムは、各値がビン内に入る確率として表示できます
ScottPlot.Plot myPlot = new();

// 値のコレクションからヒストグラムを作成する
double[] heights = SampleData.MaleHeights();
var hist = ScottPlot.Statistics.Histogram.WithBinCount(10, heights);

// ヒストグラムを棒グラフとして表示する
var barPlot = myPlot.Add.Bars(hist.Bins, hist.GetProbability(100));

// 各棒のスタイルをカスタマイズする
foreach (var bar in barPlot.Bars)
{
    bar.Size = hist.FirstBinSize * 0.8;
}

// プロットのスタイルをカスタマイズする
myPlot.Axes.Margins(bottom: 0);
myPlot.YLabel("確率 (%)");
myPlot.XLabel("身長 (cm)");

myPlot.SavePng("demo.png", 400, 300);
このレシピは、ヒストグラムカテゴリに含まれる多数のレシピのうちの1つです