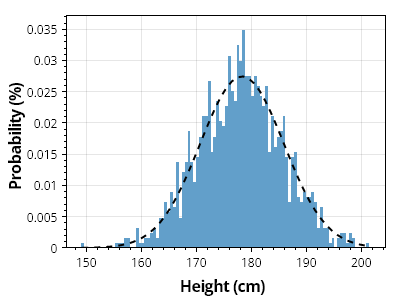
確率曲線付きヒストグラム
ガウス分布のサンプルに対して確率曲線を生成できます。
ScottPlot.Plot myPlot = new();

// 値のコレクションからヒストグラムを作成する
double[] heights = SampleData.MaleHeights();
var hist = ScottPlot.Statistics.Histogram.WithBinCount(100, heights);

// ヒストグラムを棒グラフとして表示する
var barPlot = myPlot.Add.Bars(hist.Bins, hist.GetProbability());

// 各バーのスタイルをカスタマイズする
foreach (var bar in barPlot.Bars)
{
    bar.Size = hist.FirstBinSize;
    bar.LineWidth = 0;
    bar.FillStyle.AntiAlias = false;
    bar.FillColor = Colors.C0.Lighten(.3);
}

// ヒストグラムの上に確率曲線をプロットする
ScottPlot.Statistics.ProbabilityDensity pd = new(heights);
double[] xs = Generate.Range(heights.Min(), heights.Max(), 1);
double sumBins = hist.Bins.Select(x => pd.GetY(x)).Sum();
double[] ys = pd.GetYs(xs, 1.0 / sumBins);

var curve = myPlot.Add.ScatterLine(xs, ys);
curve.LineWidth = 2;
curve.LineColor = Colors.Black;
curve.LinePattern = LinePattern.DenselyDashed;

// プロットのスタイルをカスタマイズする
myPlot.Axes.Margins(bottom: 0);
myPlot.YLabel("確率 (%)");
myPlot.XLabel("身長 (cm)");

myPlot.SavePng("demo.png", 400, 300);
このレシピは、ヒストグラムカテゴリにある多数のレシピのうちの1つです