上下が塗りつぶされた散布図
FillY 値の上側と下側の塗りつぶし領域は、個別にカスタマイズできます
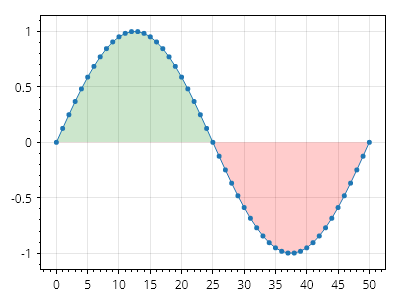
ScottPlot.Plot myPlot = new();

double[] xs = Generate.Consecutive(51);
double[] ys = Generate.Sin(51);

var sp = myPlot.Add.Scatter(xs, ys);
sp.FillY = true;
sp.FillYValue = 0;
sp.FillYAboveColor = Colors.Green.WithAlpha(.2);
sp.FillYBelowColor = Colors.Red.WithAlpha(.2);

myPlot.SavePng("demo.png", 400, 300);
このレシピは、散布図カテゴリに含まれる多数のレシピの 1 つです