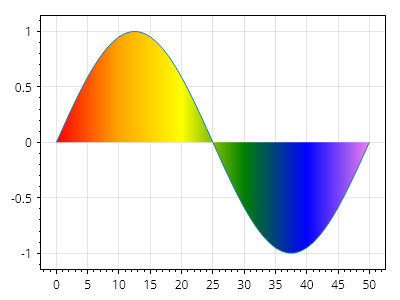
グラデーション塗りつぶし付き散布図
散布図の下の領域は、カスタムの色グラデーションで塗りつぶすことができます。
ScottPlot.Plot myPlot = new();

double[] xs = Generate.Consecutive(51);
double[] ys = Generate.Sin(51);

var poly = myPlot.Add.ScatterLine(xs, ys);
poly.FillY = true;

// 色はX軸上の特定の位置に配置されます
poly.AxisGradientDirection = AxisGradientDirection.Horizontal;
poly.ColorPositions.Add(new(Colors.Red, 0));
poly.ColorPositions.Add(new(Colors.Orange, 10));
poly.ColorPositions.Add(new(Colors.Yellow, 20));
poly.ColorPositions.Add(new(Colors.Green, 30));
poly.ColorPositions.Add(new(Colors.Blue, 40));
poly.ColorPositions.Add(new(Colors.Violet, 50));

myPlot.SavePng("demo.png", 400, 300);
このレシピは、散布図カテゴリに含まれる多数のレシピの1つです